Advertorial revenue had stagnated for some time and so a cross-functional experimentation squad was formed with the business goal to increase conversion rate on B2 Advertorials by 30%. We set out to achieve this goal by finding out what our customers needed from us, and then finding ways to give it to them.
The goal was big, time was short, and very little was known about our customers when we started, so experimentation began with assumption testing while we gathered qual data. Finding look-alike users to talk to was easy, but getting actual customers to talk to us was much more difficult. This squad was the first truly agile team using a scrum format in the business and so we had to create our processes as we went along.
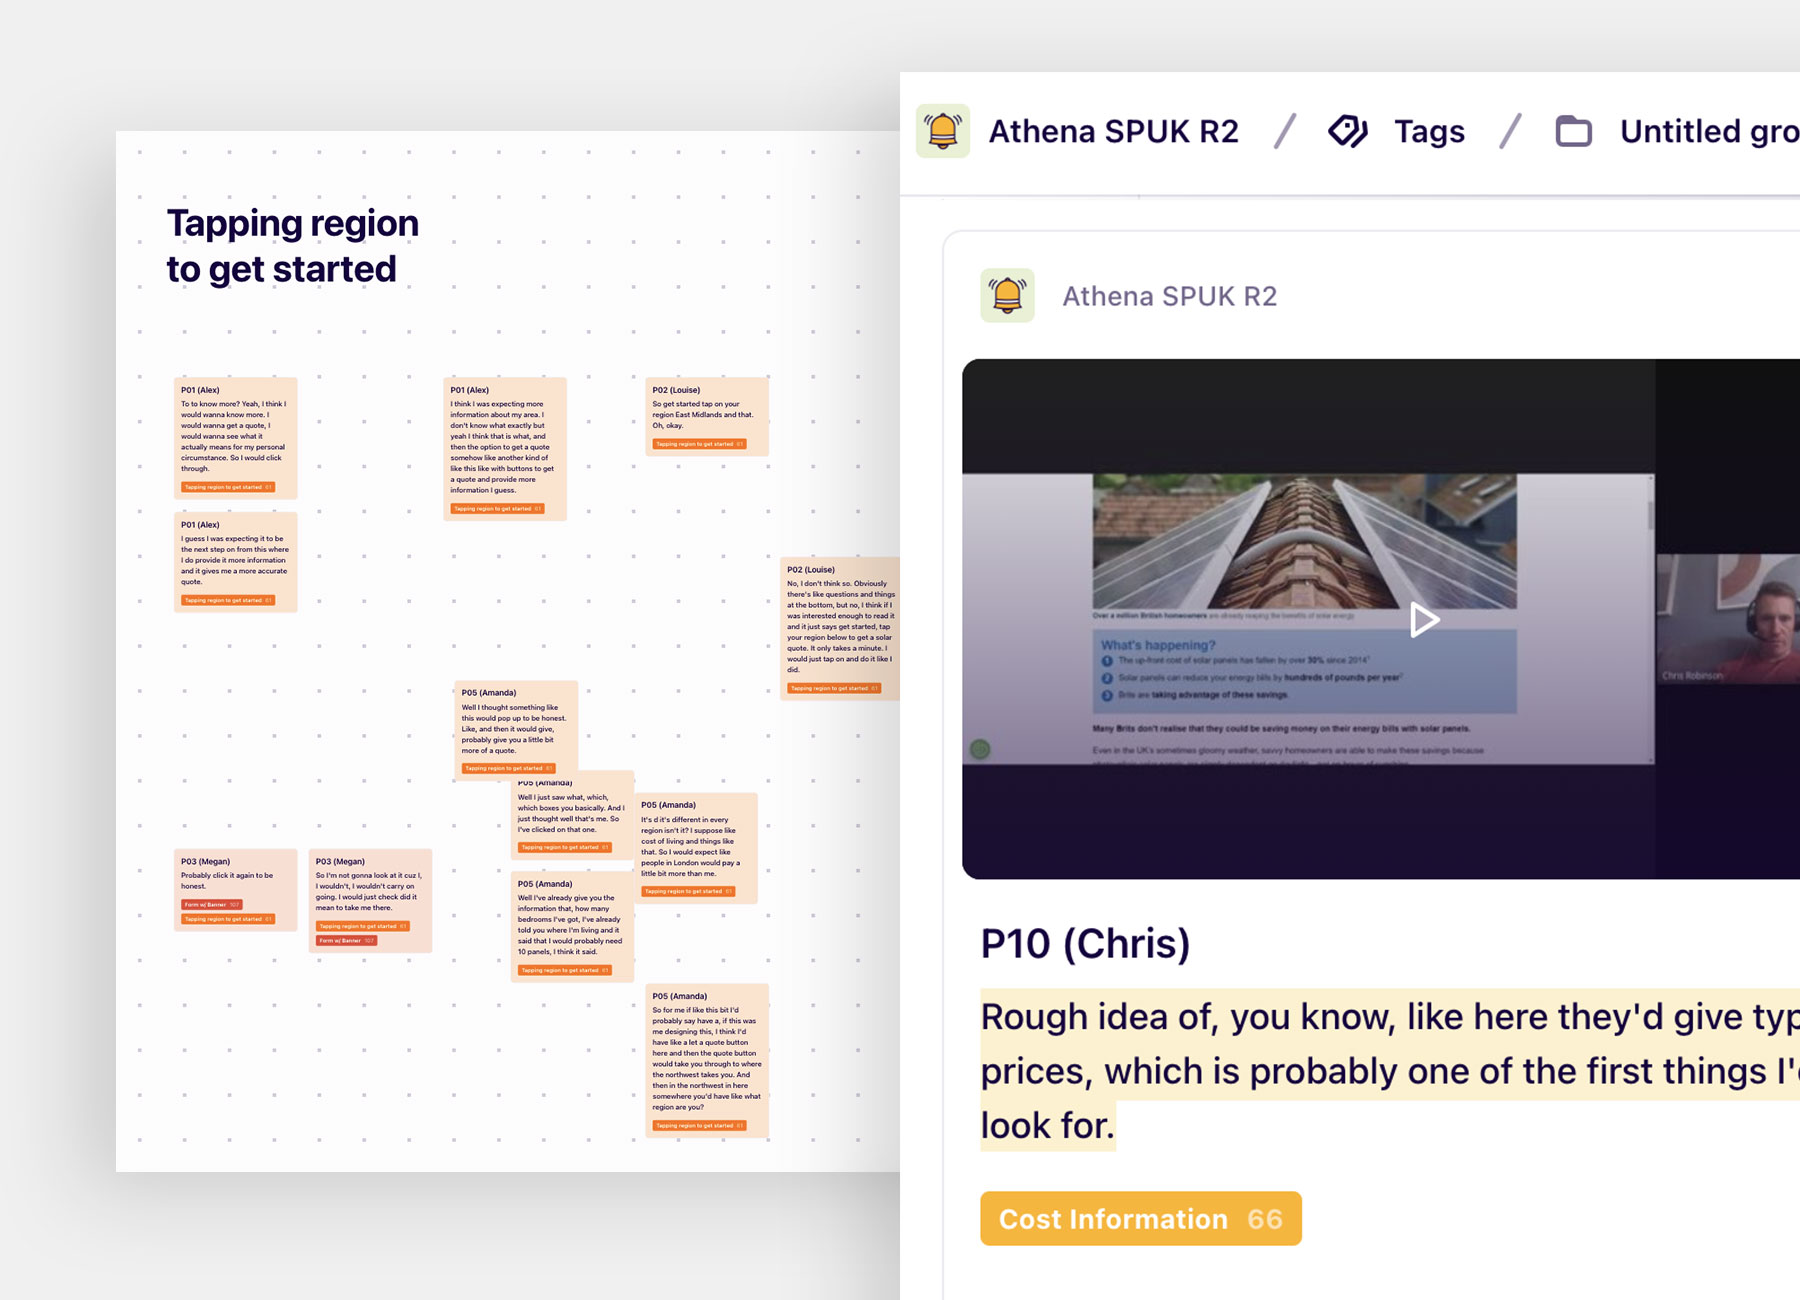
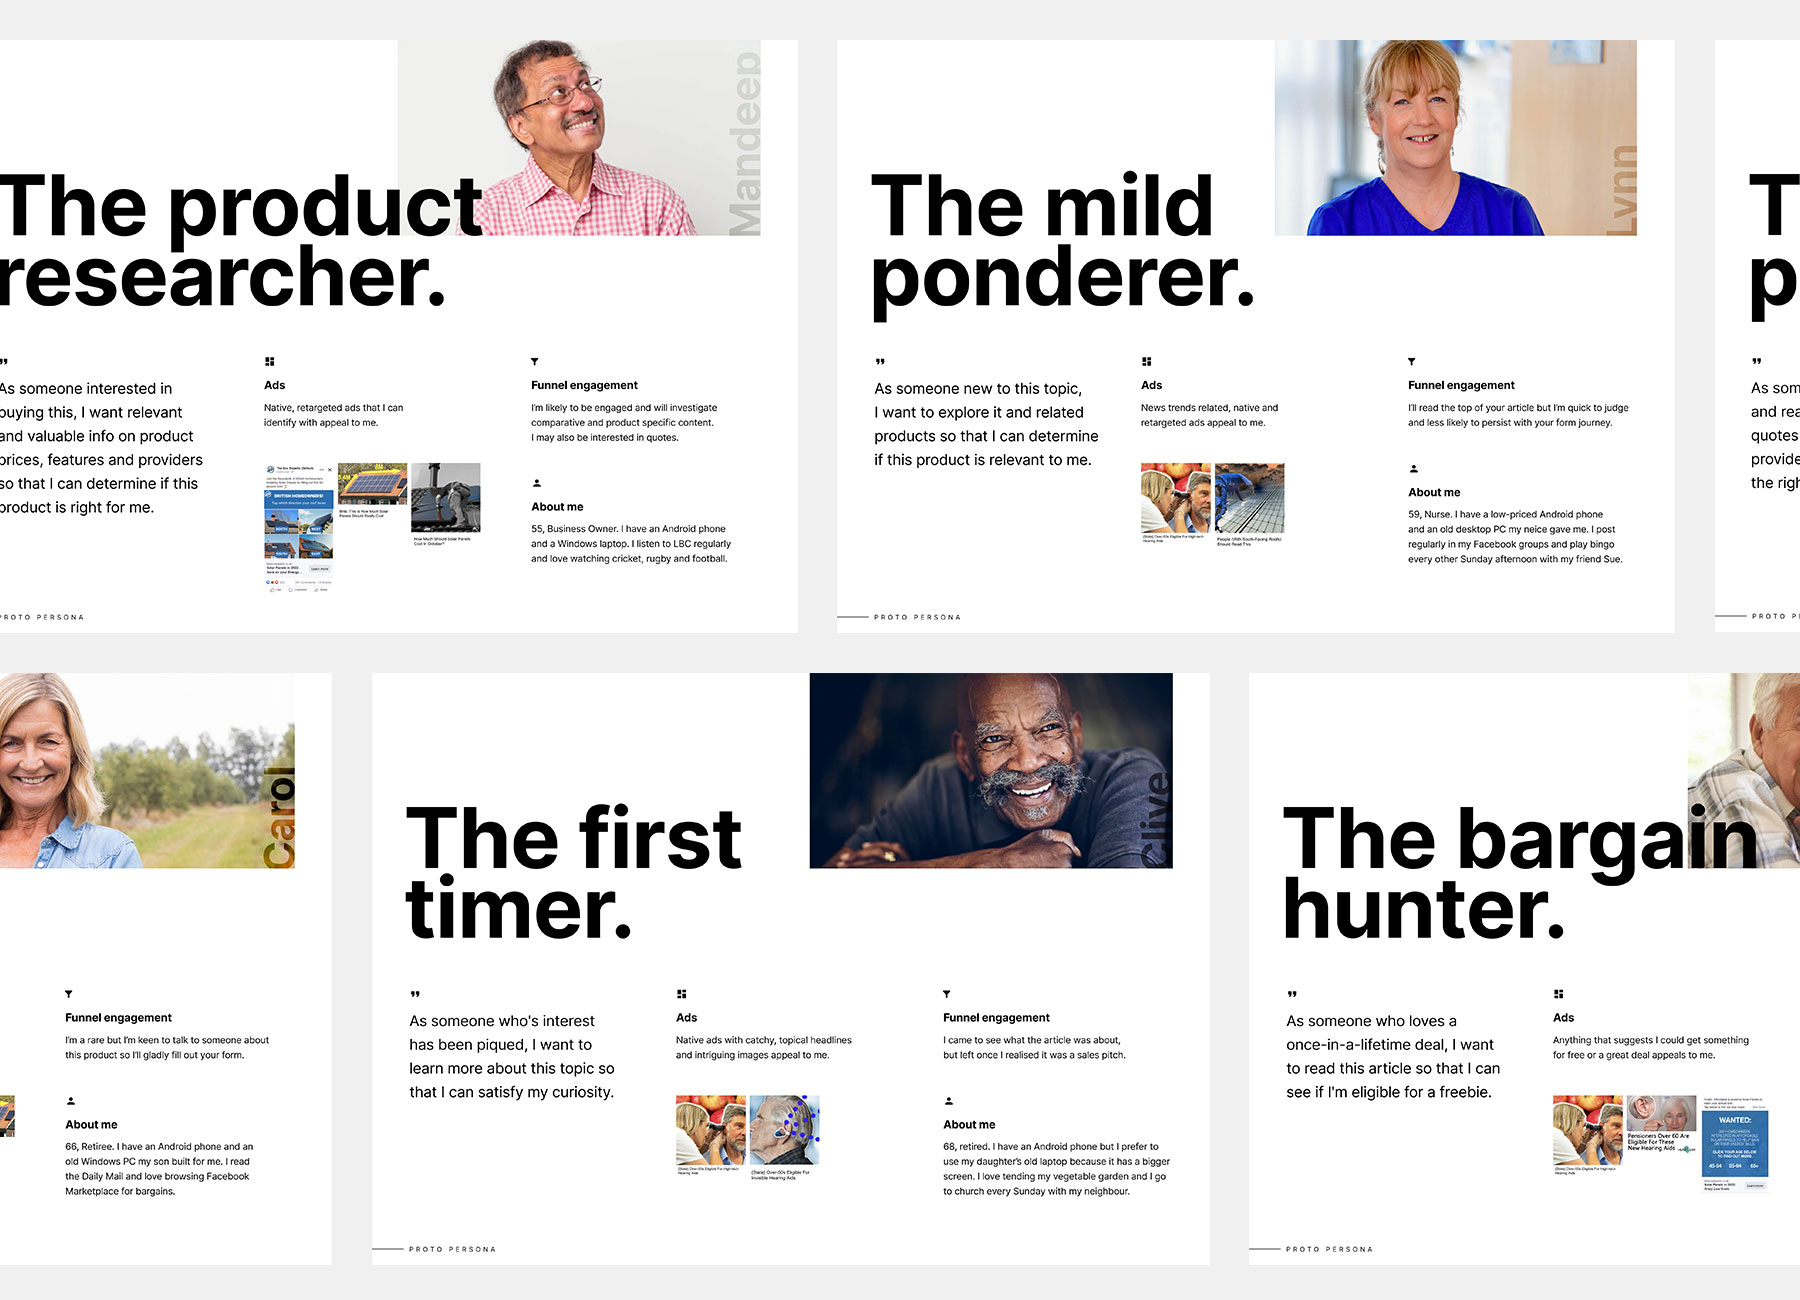
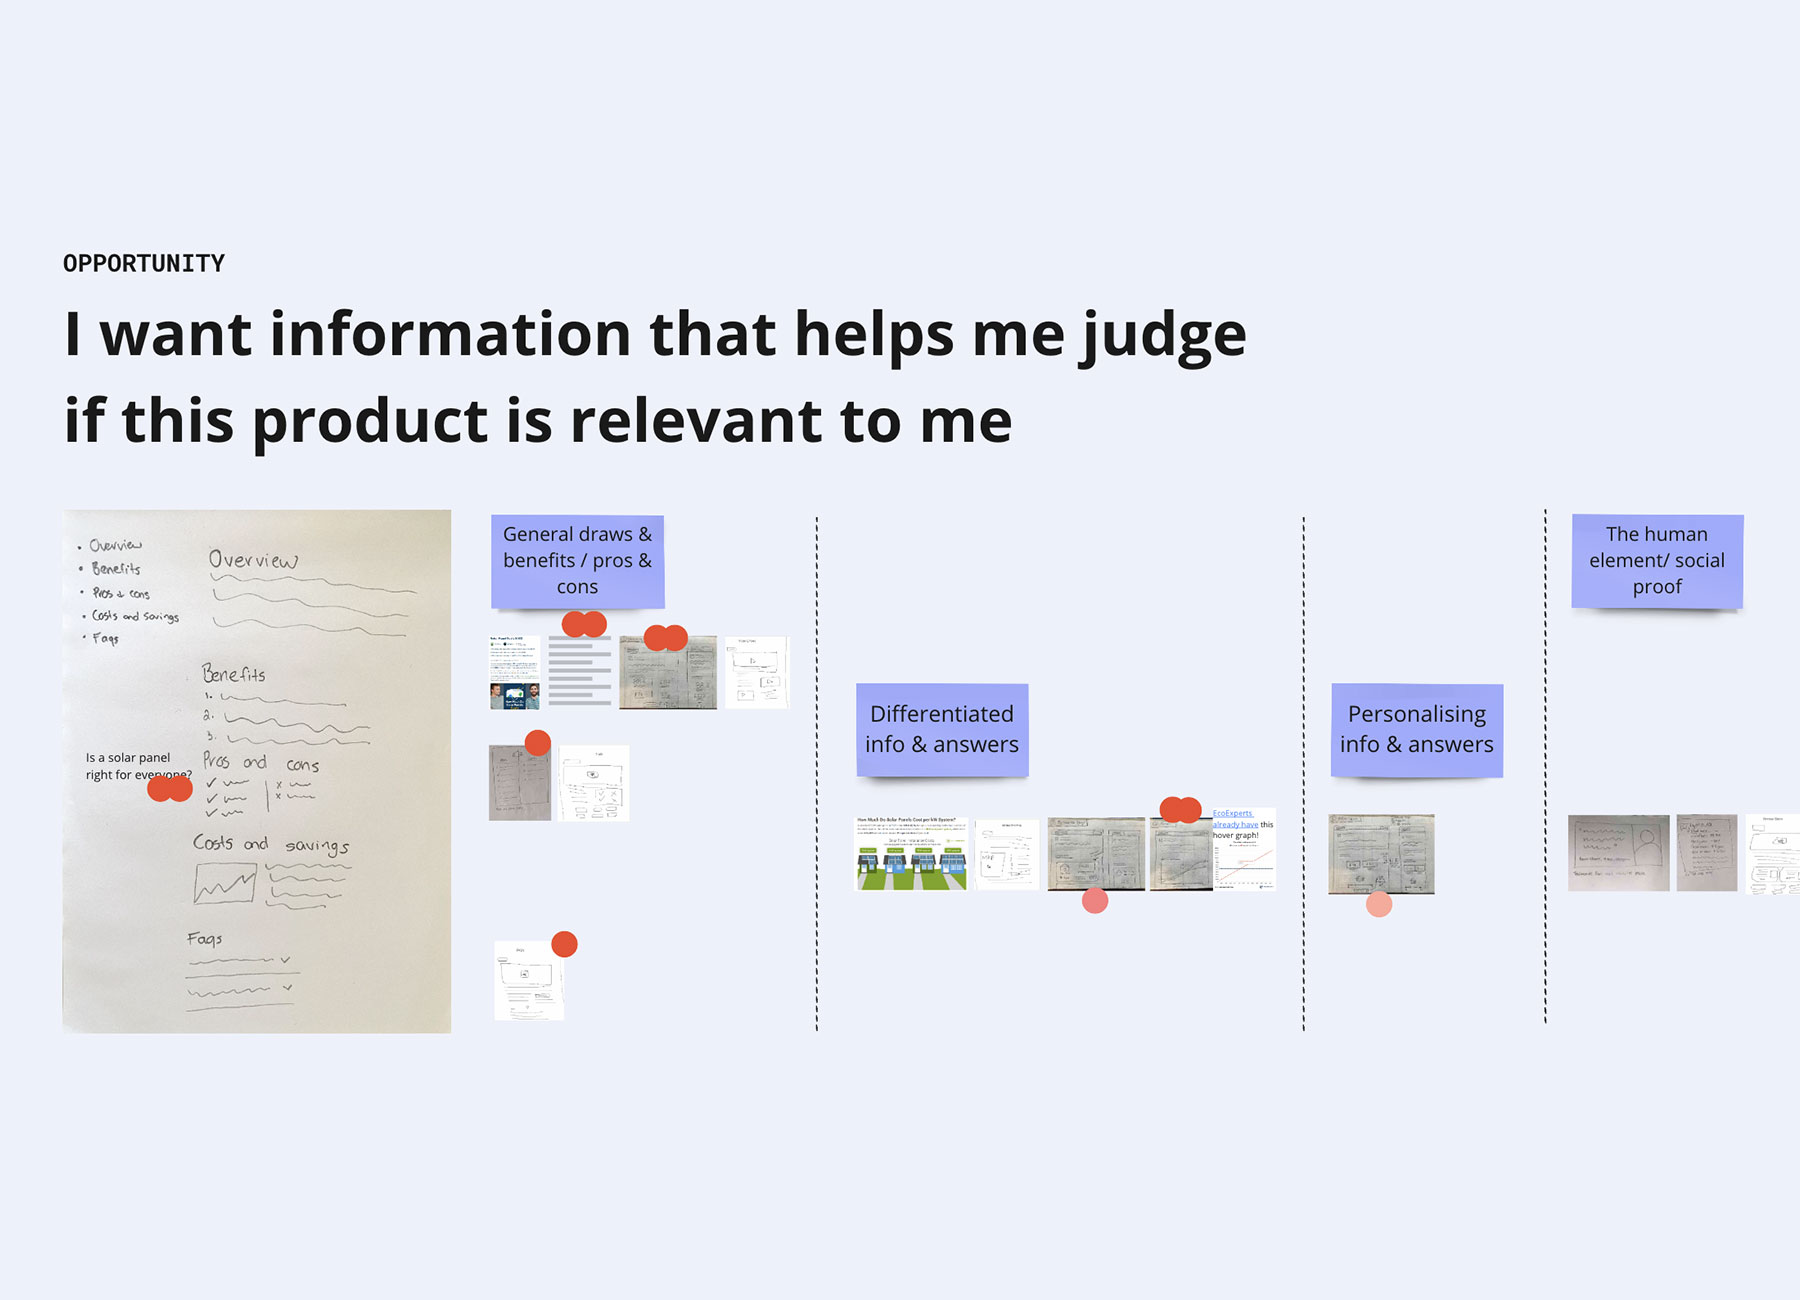
Our UX Researcher formed a research plan that included a CSAT survey, look-alike user interviews and real customer interviews. I contributed by conducting and observing user interviews, creating proto personas, and undertaking a competitor analysis. Once we compiled our research into insights, the team had a session to learn about our customers and uncover the biggest opportunities.
We worked on a backlog of experiments while we gathered qual data. These experiments were assumption-based and mainly produced flat results.
Once we had the qual data, we created experiments based on opportunities uncovered in our research, and this is where we started seeing results – both positive and negative – from which we could learn, iterate and improve upon. Our method was lean experimentation to learn as much as possible quickly, and continue to iterate.
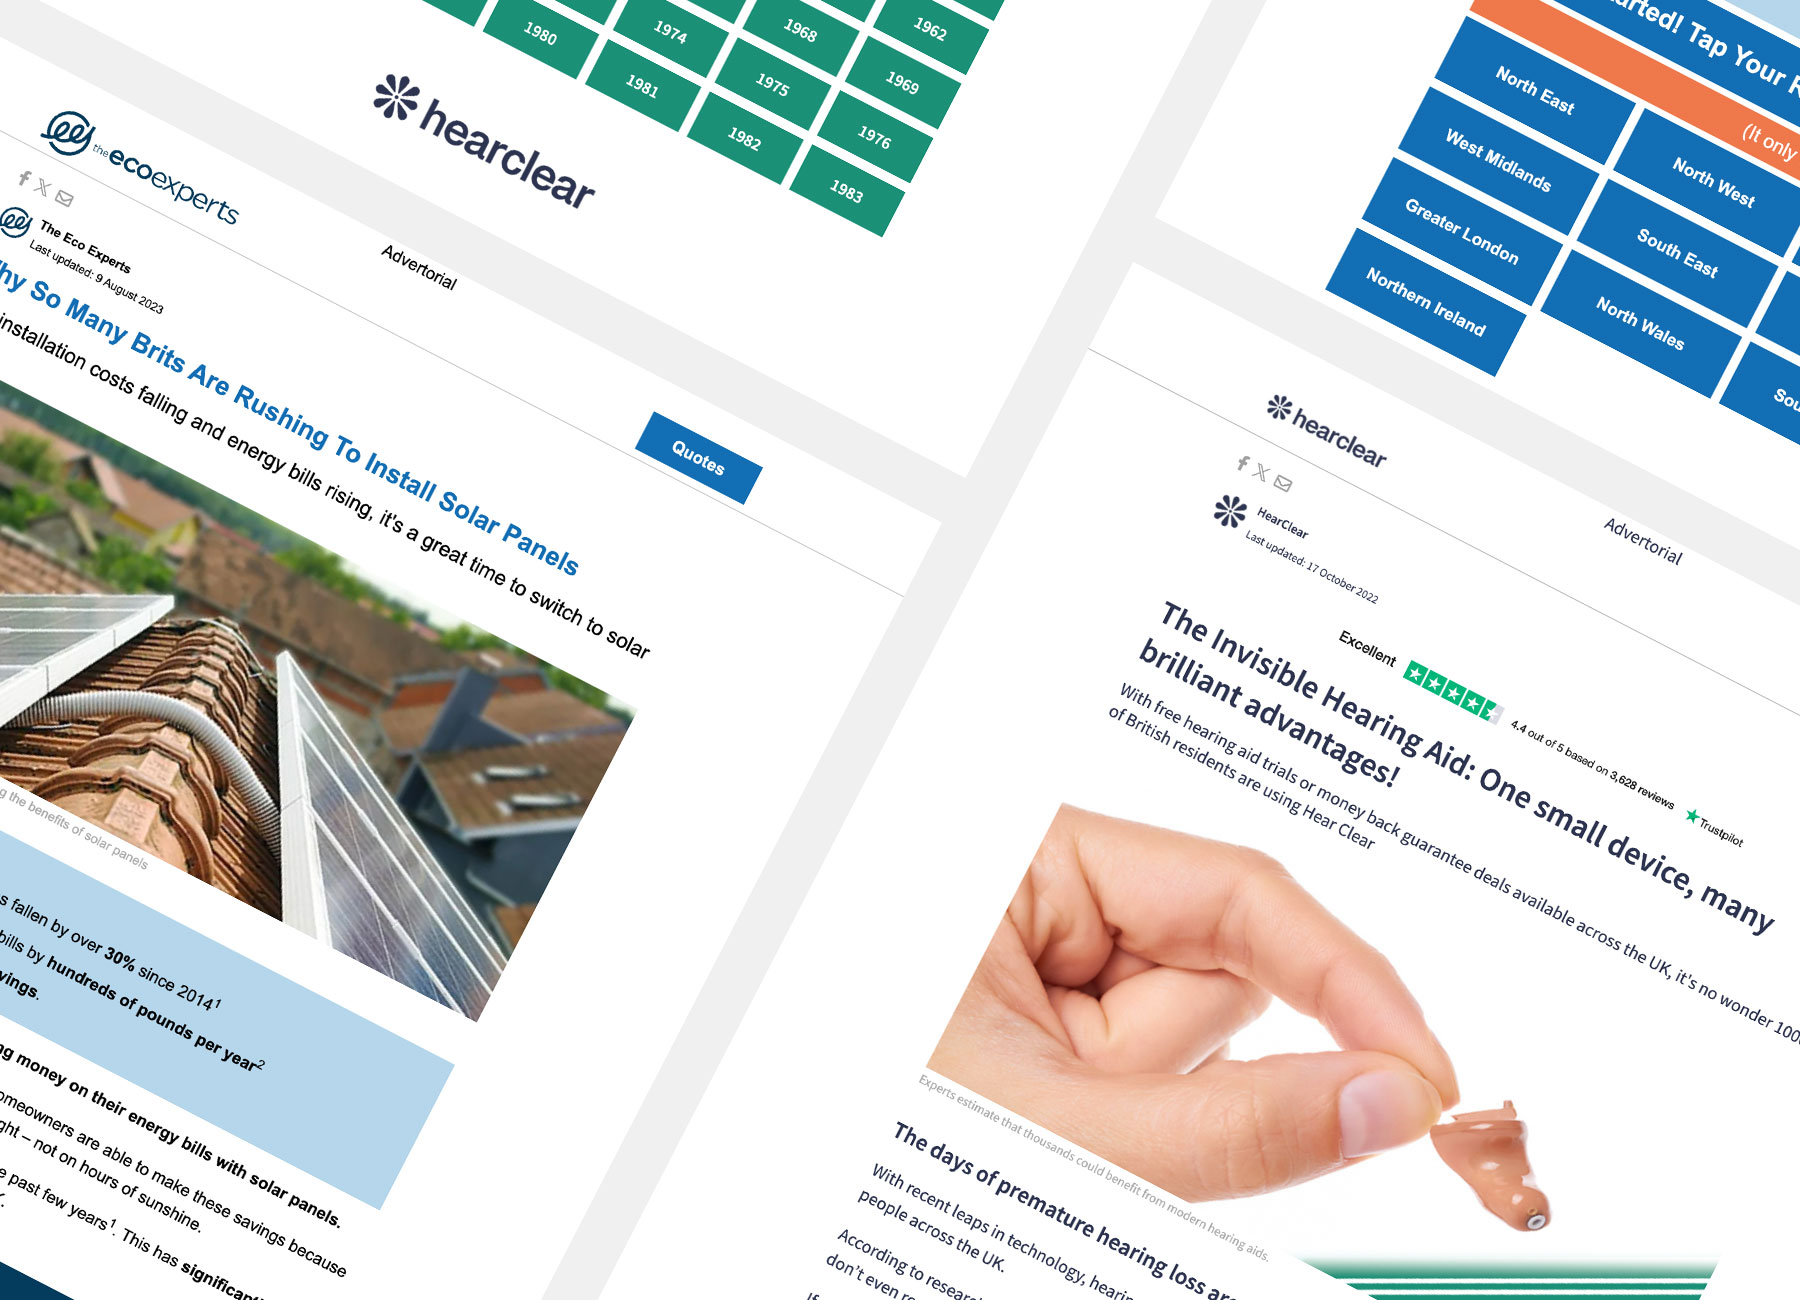
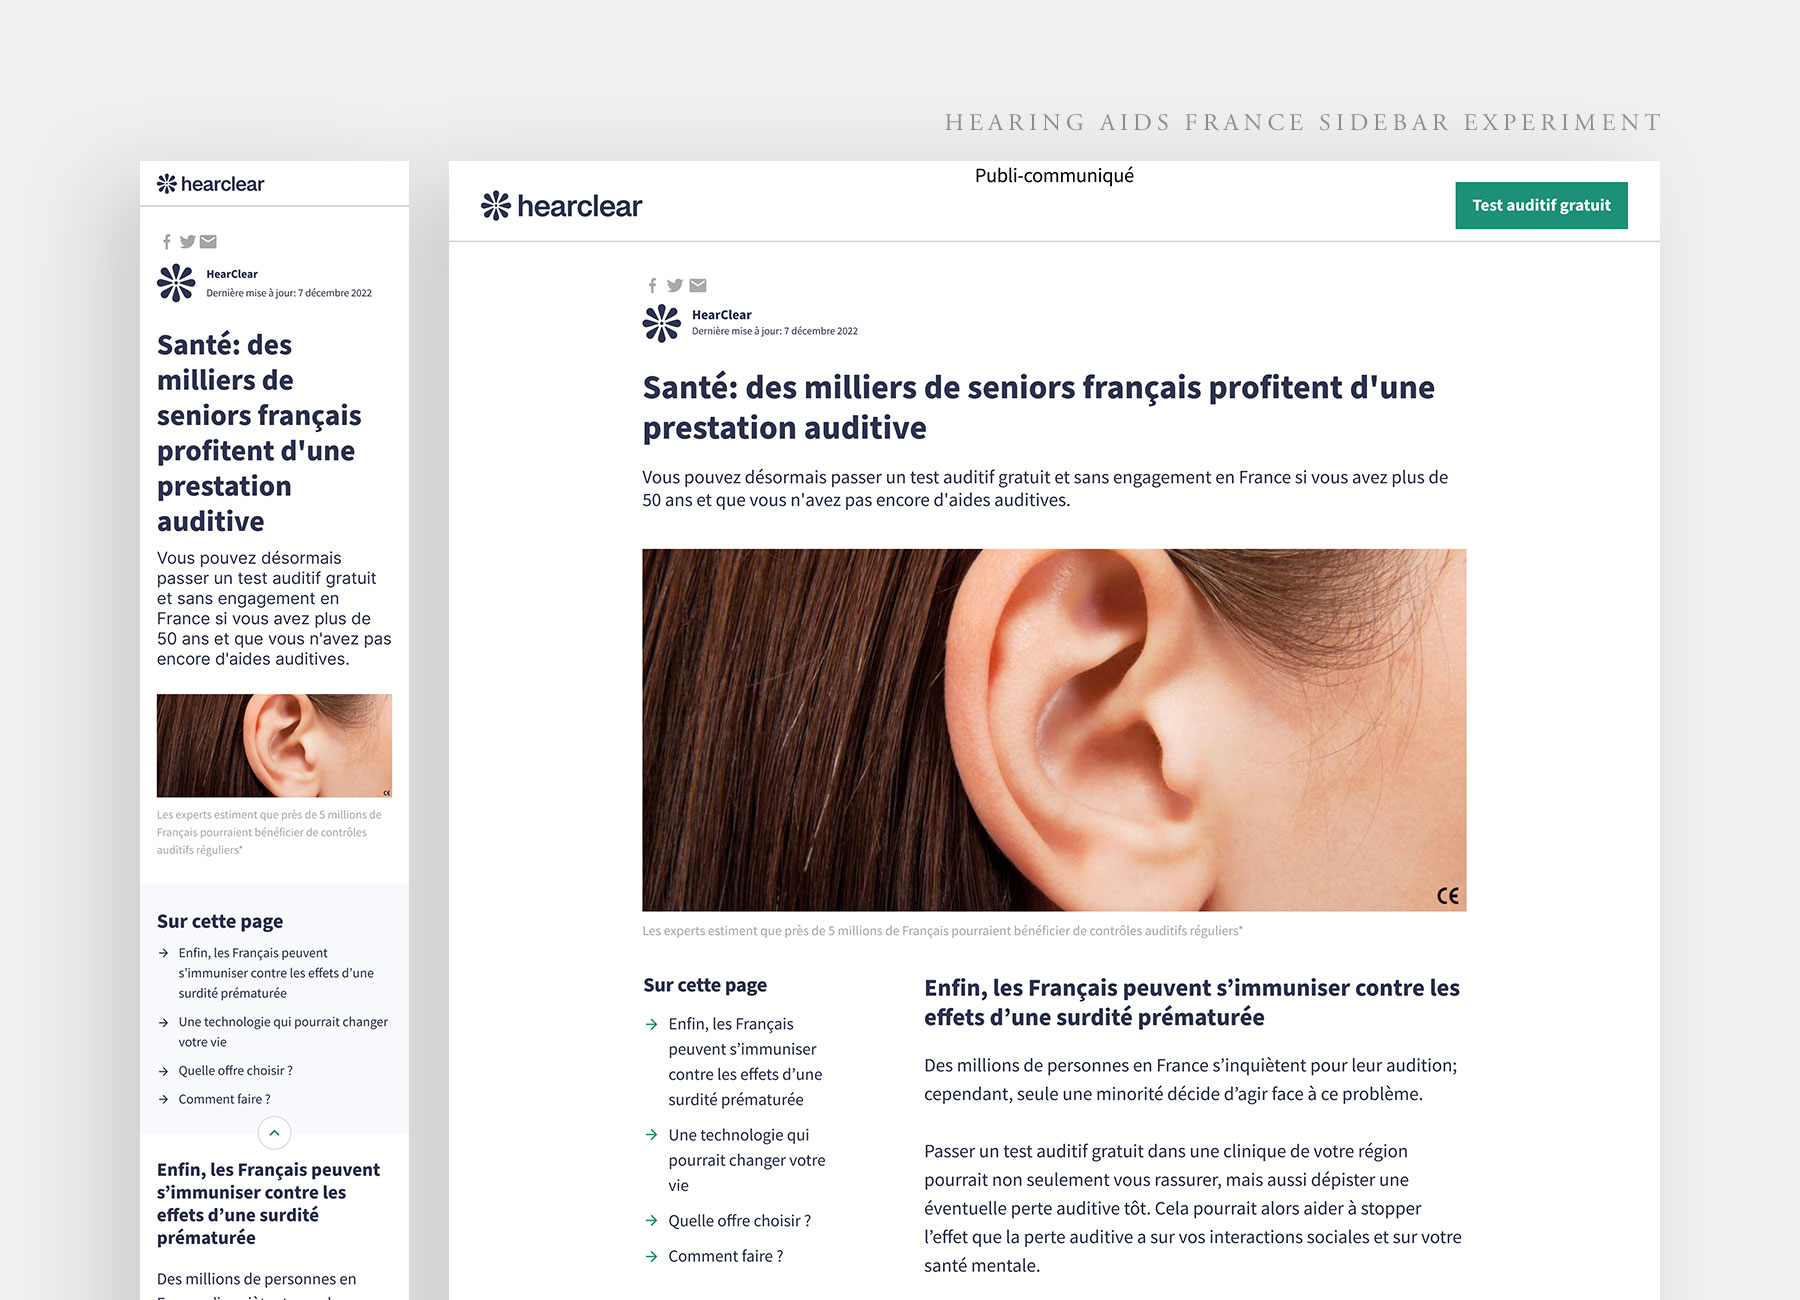
User research uncovered that our customers came to our advertorials looking for indicative product costs. Historically, showing costs on these pages harms conversion rate. Since increasing conversion rate was our goal, we had to find a way to deliver costs to our users without harming the business goal.
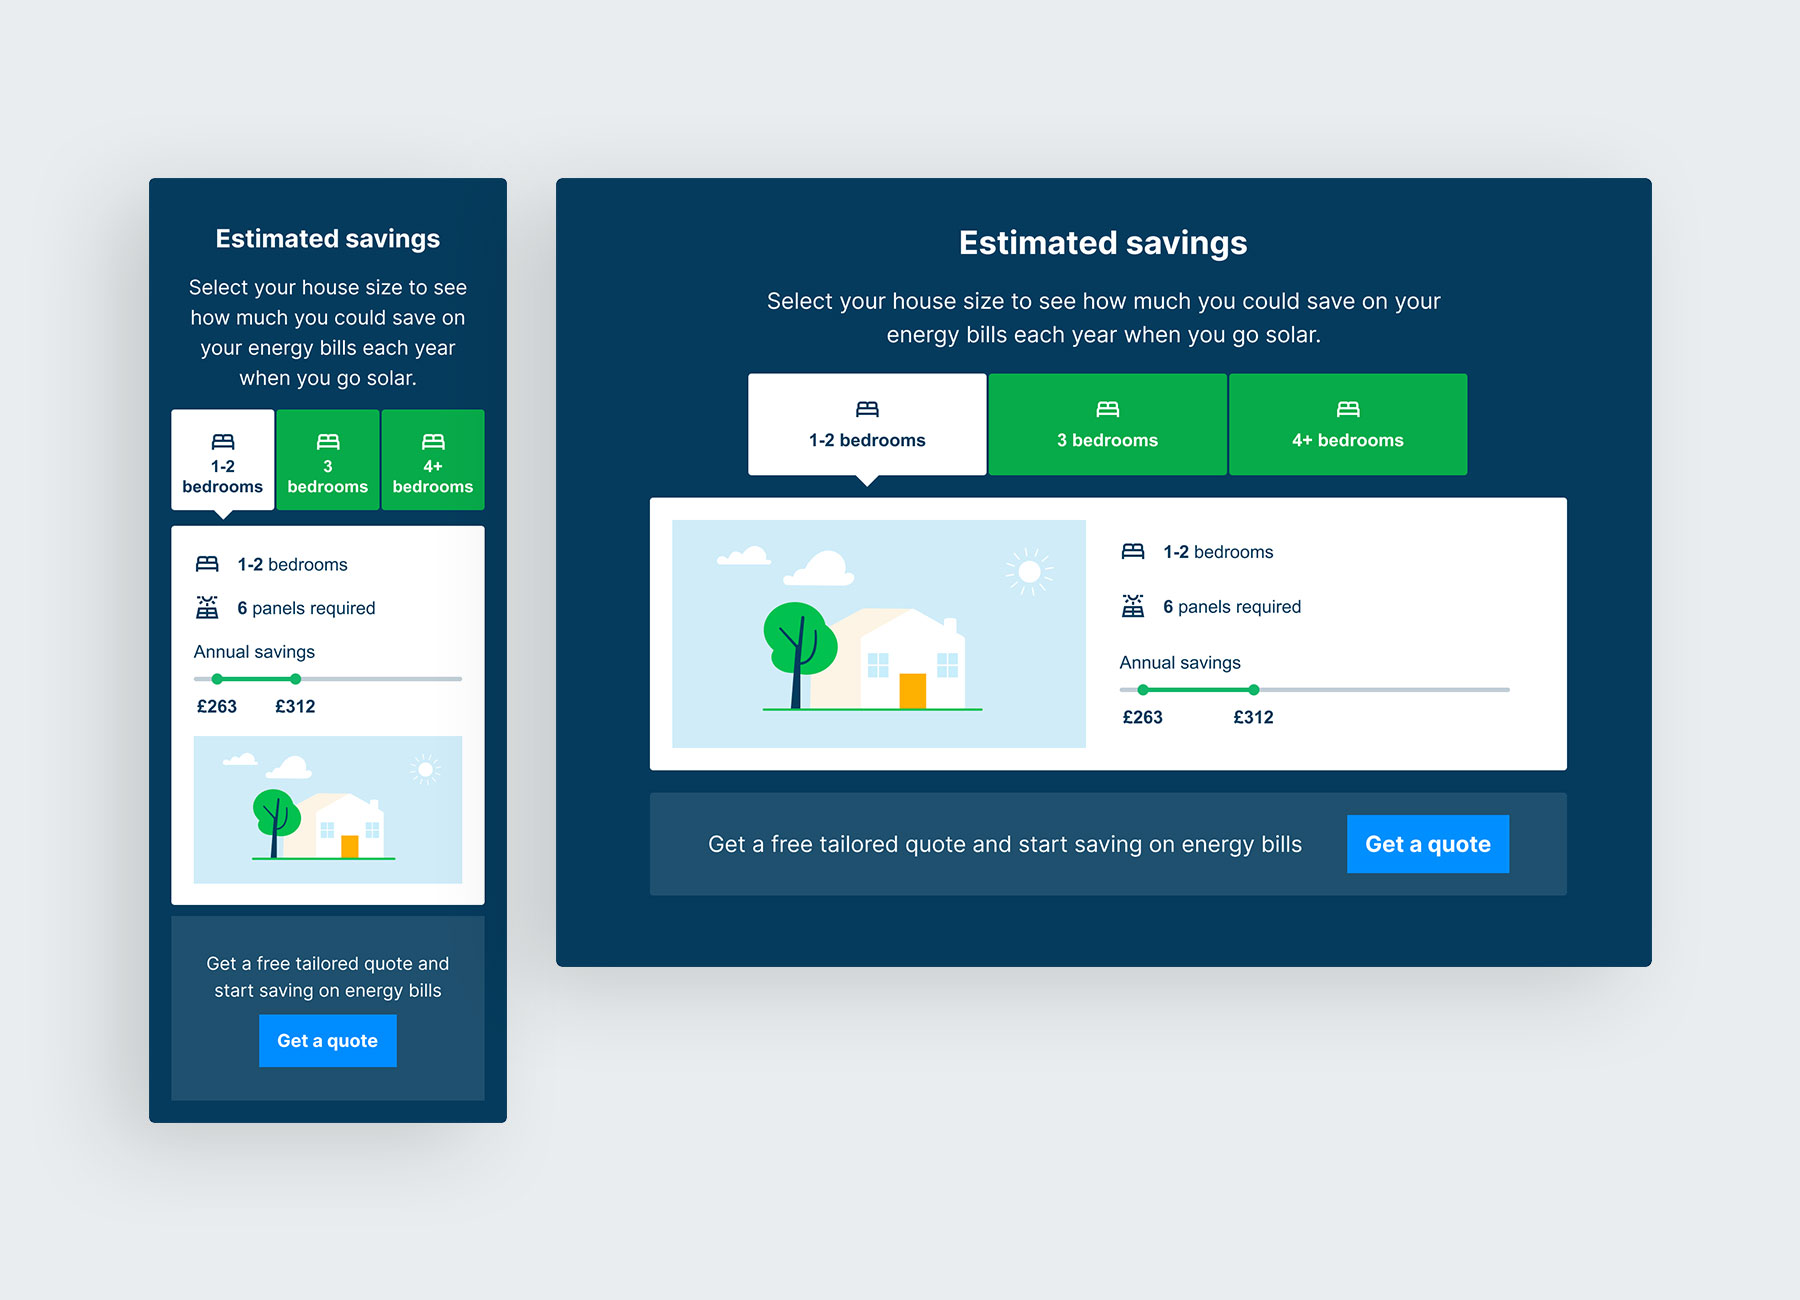
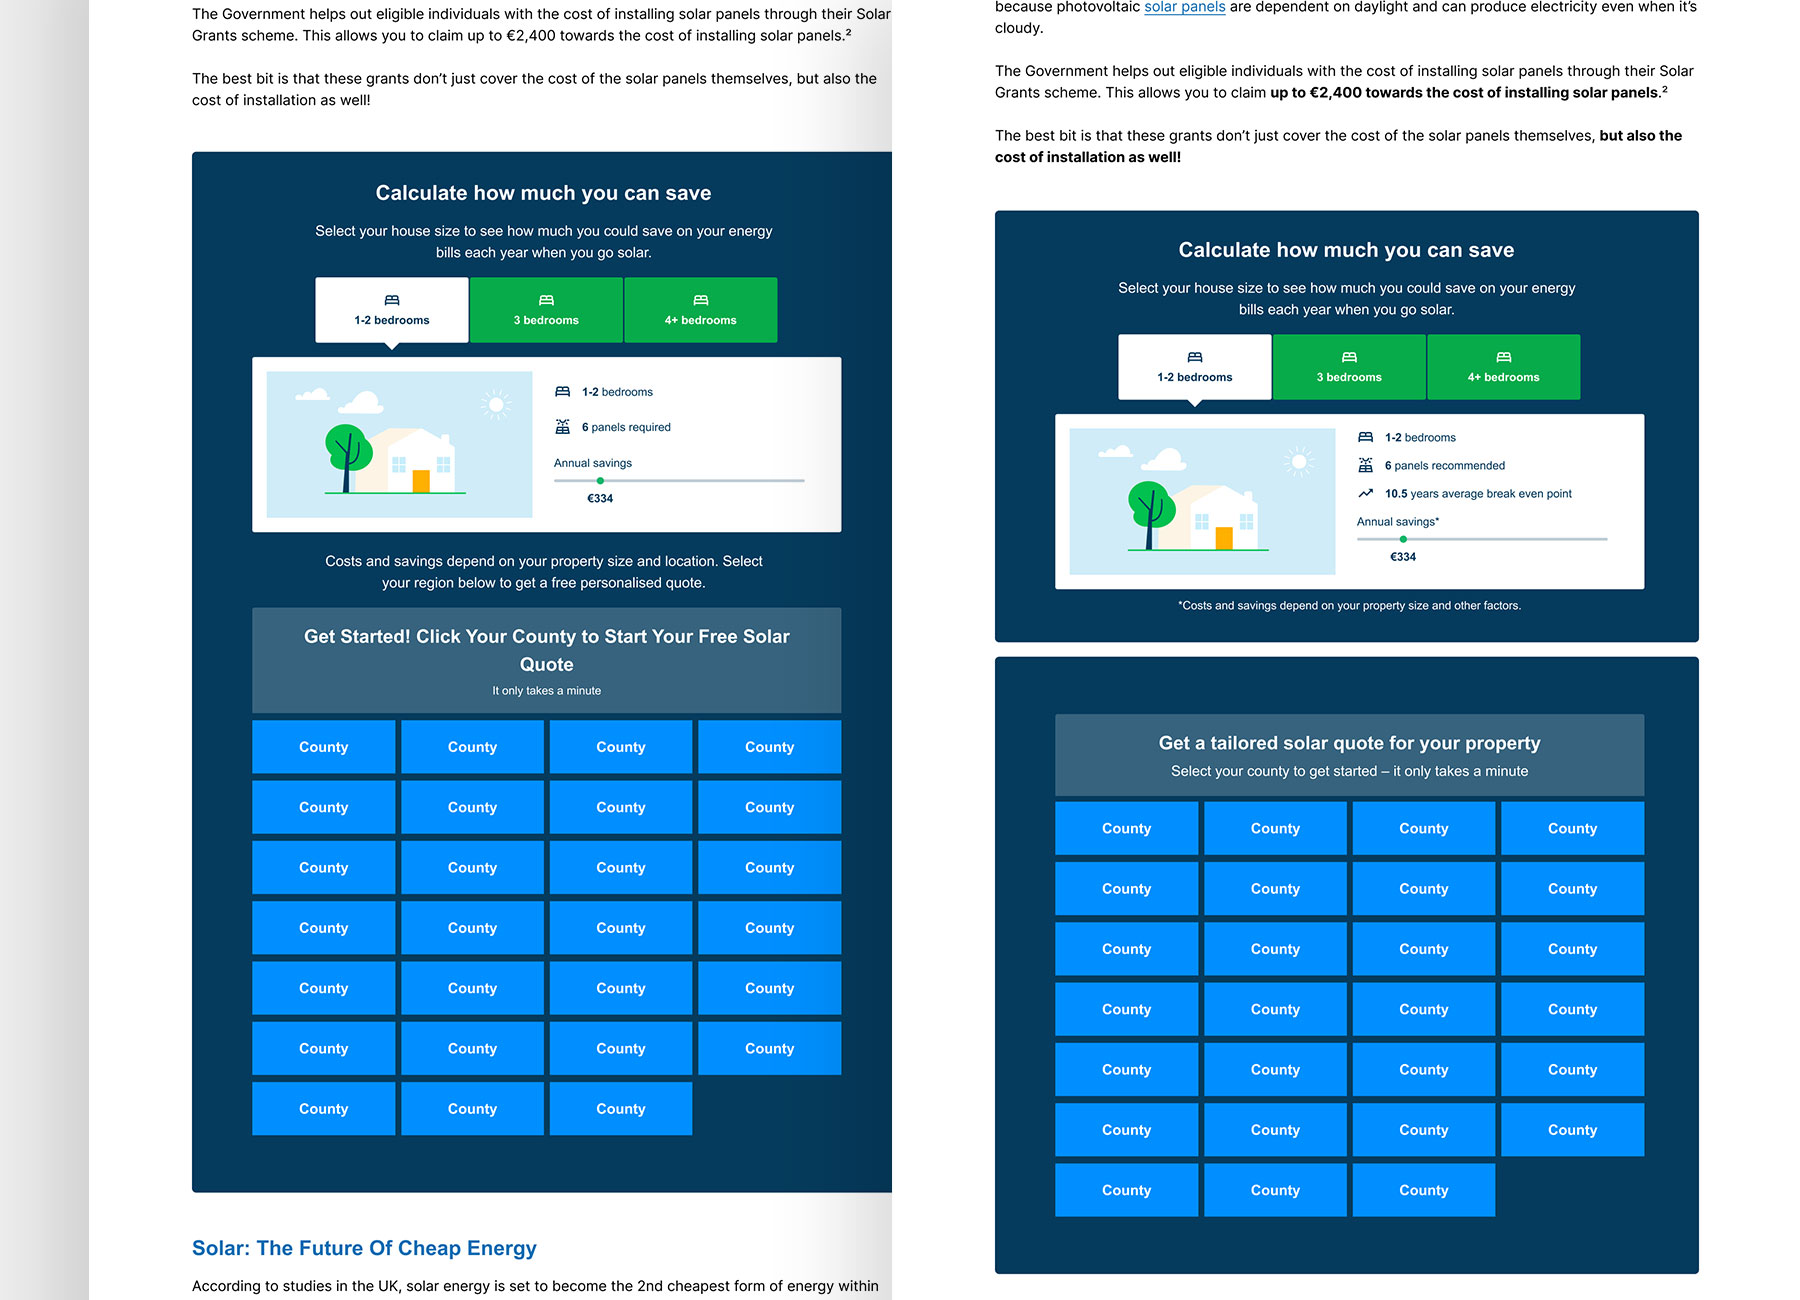
With the solar panels vertical as our primary focus, I held an ideation session with the team to answer the opportunity around costs. The idea we took forward was a calculator that showed cost savings based on a selection relevant to them – a differentiated benefits component.
We hypothesised that if users input data to receive info relevant to them, this would increase their perceived value in a quote.
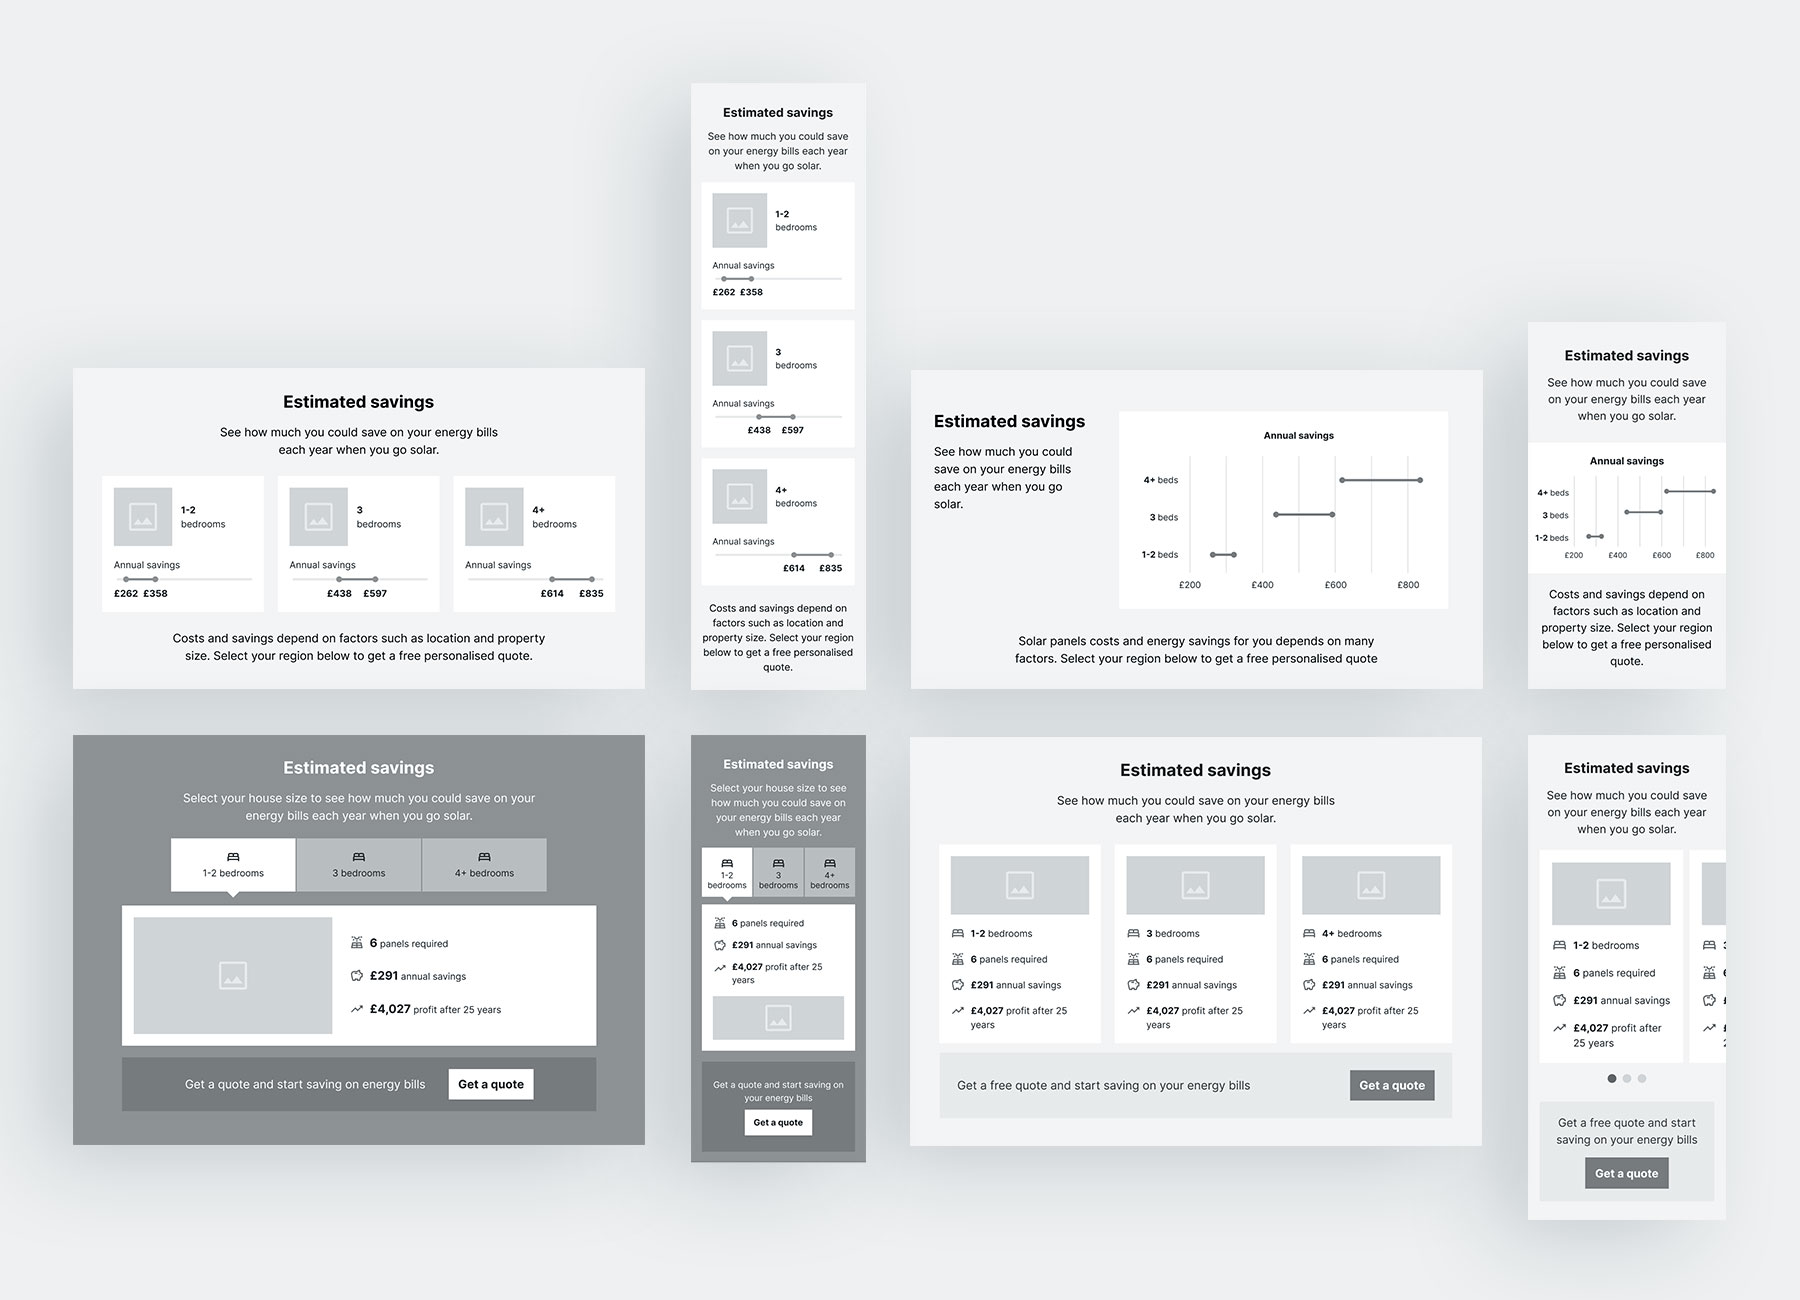
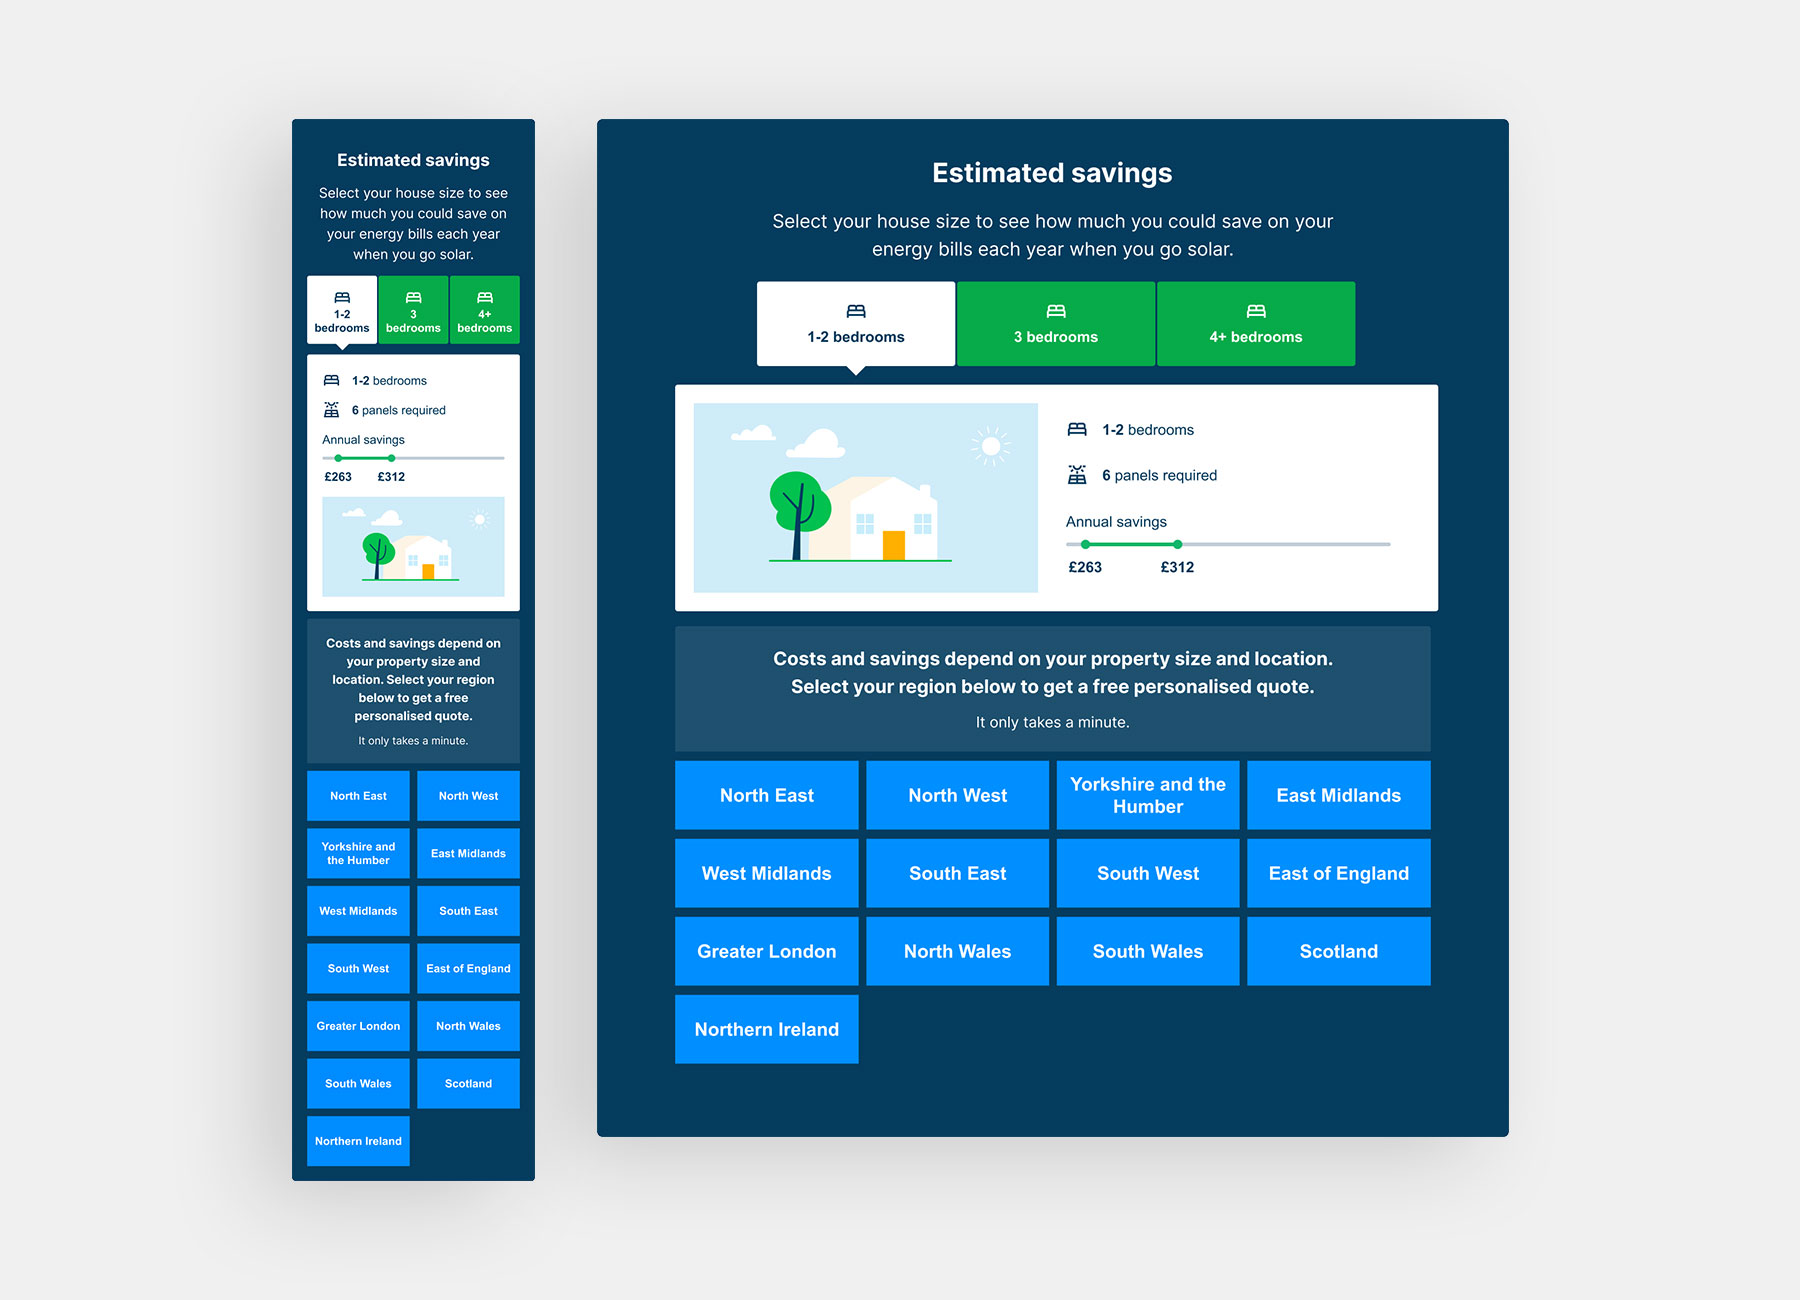
I began in Figma by wireframing a component that allows users to get info based on their choices. I leveraged existing data to create the savings calculator and mocked up four ideas for mobile and desktop. I held an adhoc feedback session where I took the squad through the four approaches and invited the team for immediate feedback and discussion. We agreed an approach with tweaks and I took the component into visual design.
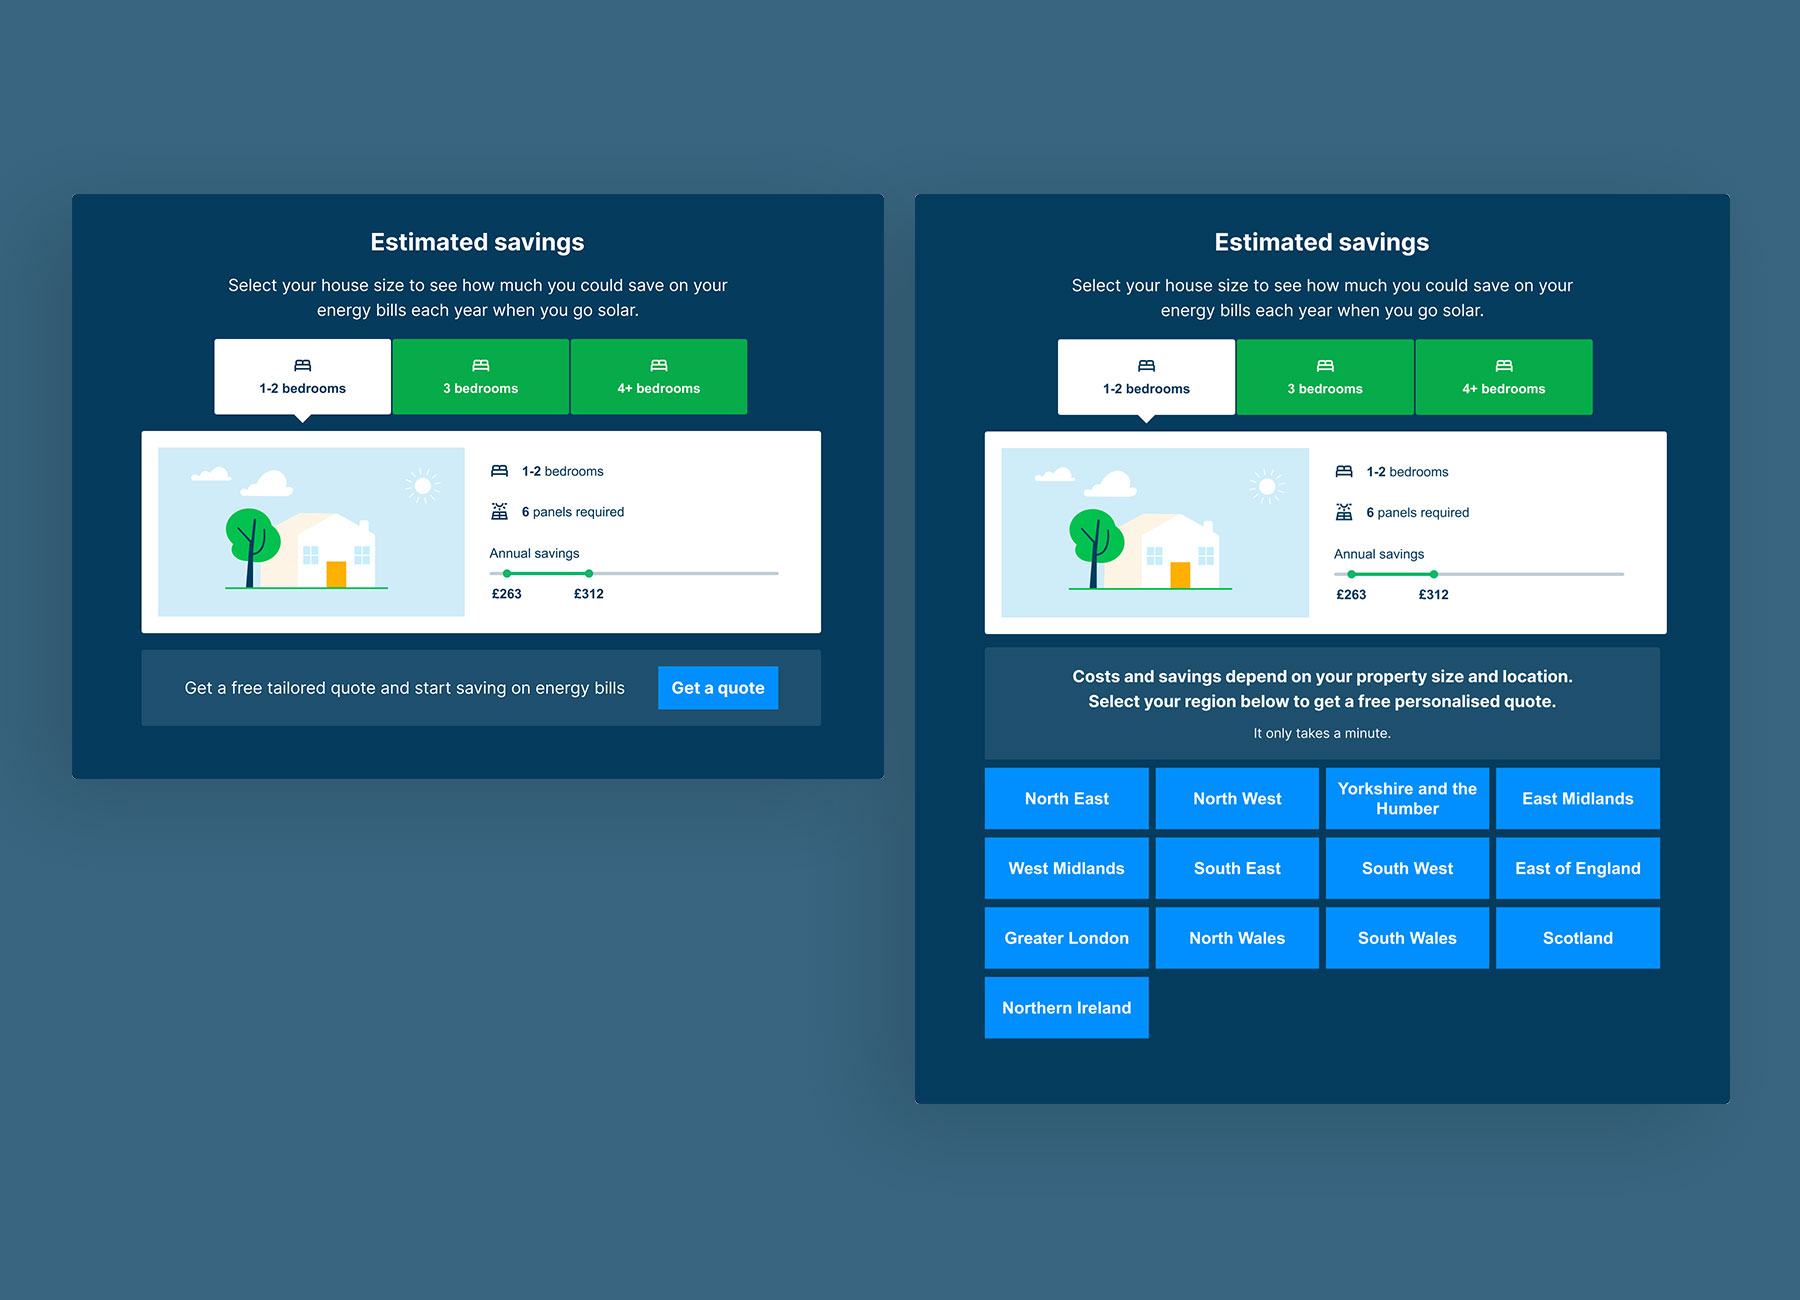
The Eco Experts had recently rebranded, so I had a lot of fresh assets to leverage. I modified illustrations to depict three house sizes and assembled a clear and engaging interface. To help users focus in on the calculator, I chose a contrasting background colour which let the component stand out from the rest of the page content.
I had some ideas on how to incorporate the call-to-action: add a 'get a quote CTA' to the bottom of the component; or merge the existing region buttons with it. Since the existing region buttons generate the most clicks and leads on the page, this seemed a logical route.
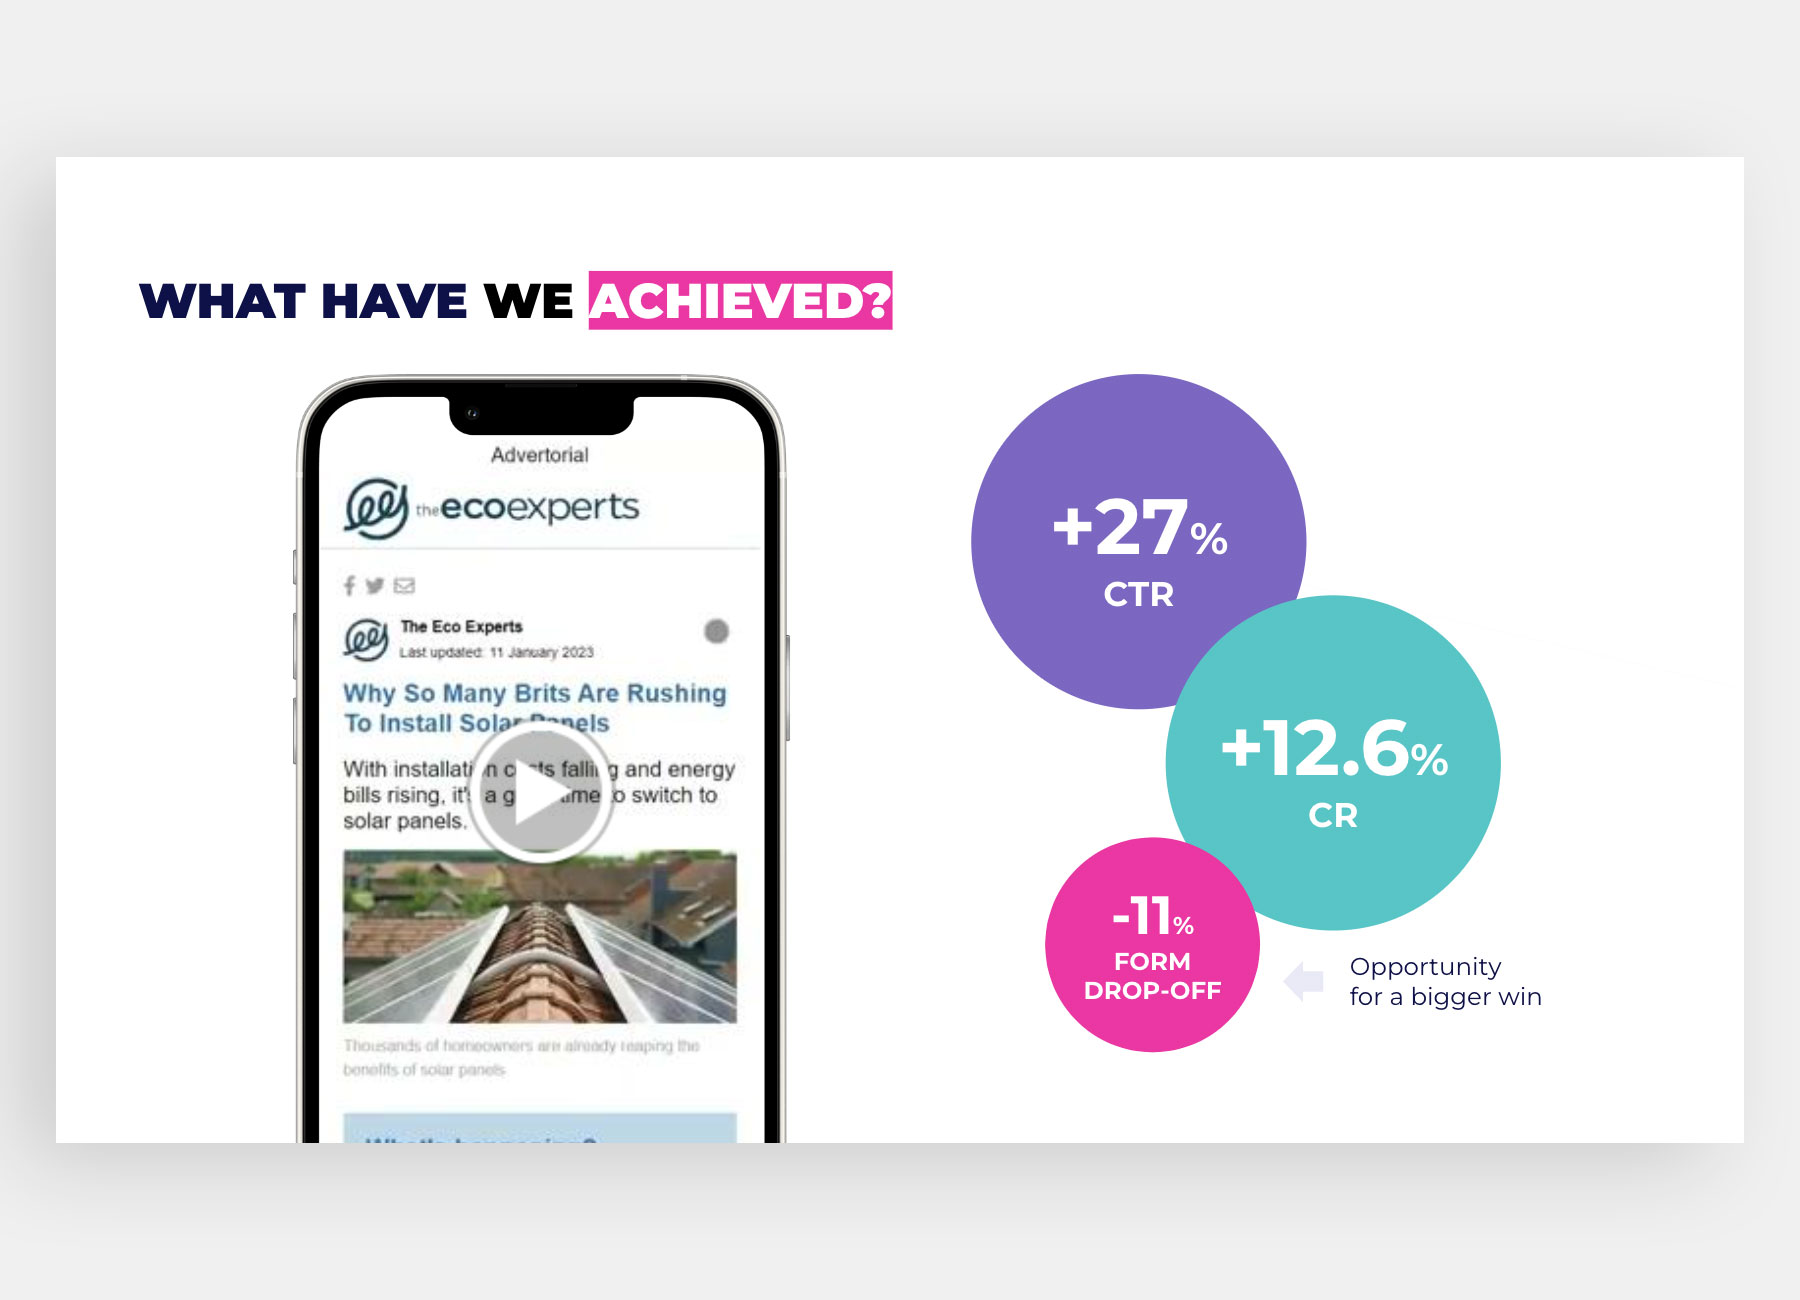
The team loved both CTA approaches and decided to A/B/C test them against the control and see which version would get the most clicks. The test was launched in Optimizely and concluded with interesting results. On variant 1, conversion rate improved by 12.6%, click through rate was up by 27%, time on site increased by 25%, and scroll-depth increased by 25%. Variant 2 saw lower numbers than variant 1 across all metrics so we decided to move forward with variant 1.
Though we positively affected user behaviour through our primary and secondary metrics, form drop-off rate remained high. The UX Researcher and I set up look-alike user interviews to get qual data on what was driving people to click but then drop off immediately.
While we gathered qual data, we iterated on the messaging and the quant results suggested that messaging played an important part in increasing CTR and CR, but we were still clueless as to why the form drop-off remained so high.
The next round of interviews uncovered that users clicked the region buttons not to progress to a quote with the form, but to see savings more relevant to them.
Merging the region buttons with the savings calculator visually, made users think they were linked, so they dropped off from the form page due to mismanaged expectations.
But this was great news – we had evidence to explain how the component actually affected user behaviour, the numbers to back it up, and knowledge from which to iterate further. The component has now been rolled out to the template for several countries, though testing is ongoing. We're seeing a small reduction in form drop-off as we iterate on visual and messaging hierarchy.